Research Visualizations
22 Figures
Interactive Zoom
Click any visualization for an immersive full-screen experience with pan & zoom. Use mouse wheel or pinch gestures to zoom, drag to pan when zoomed in.
Click to zoom
A1
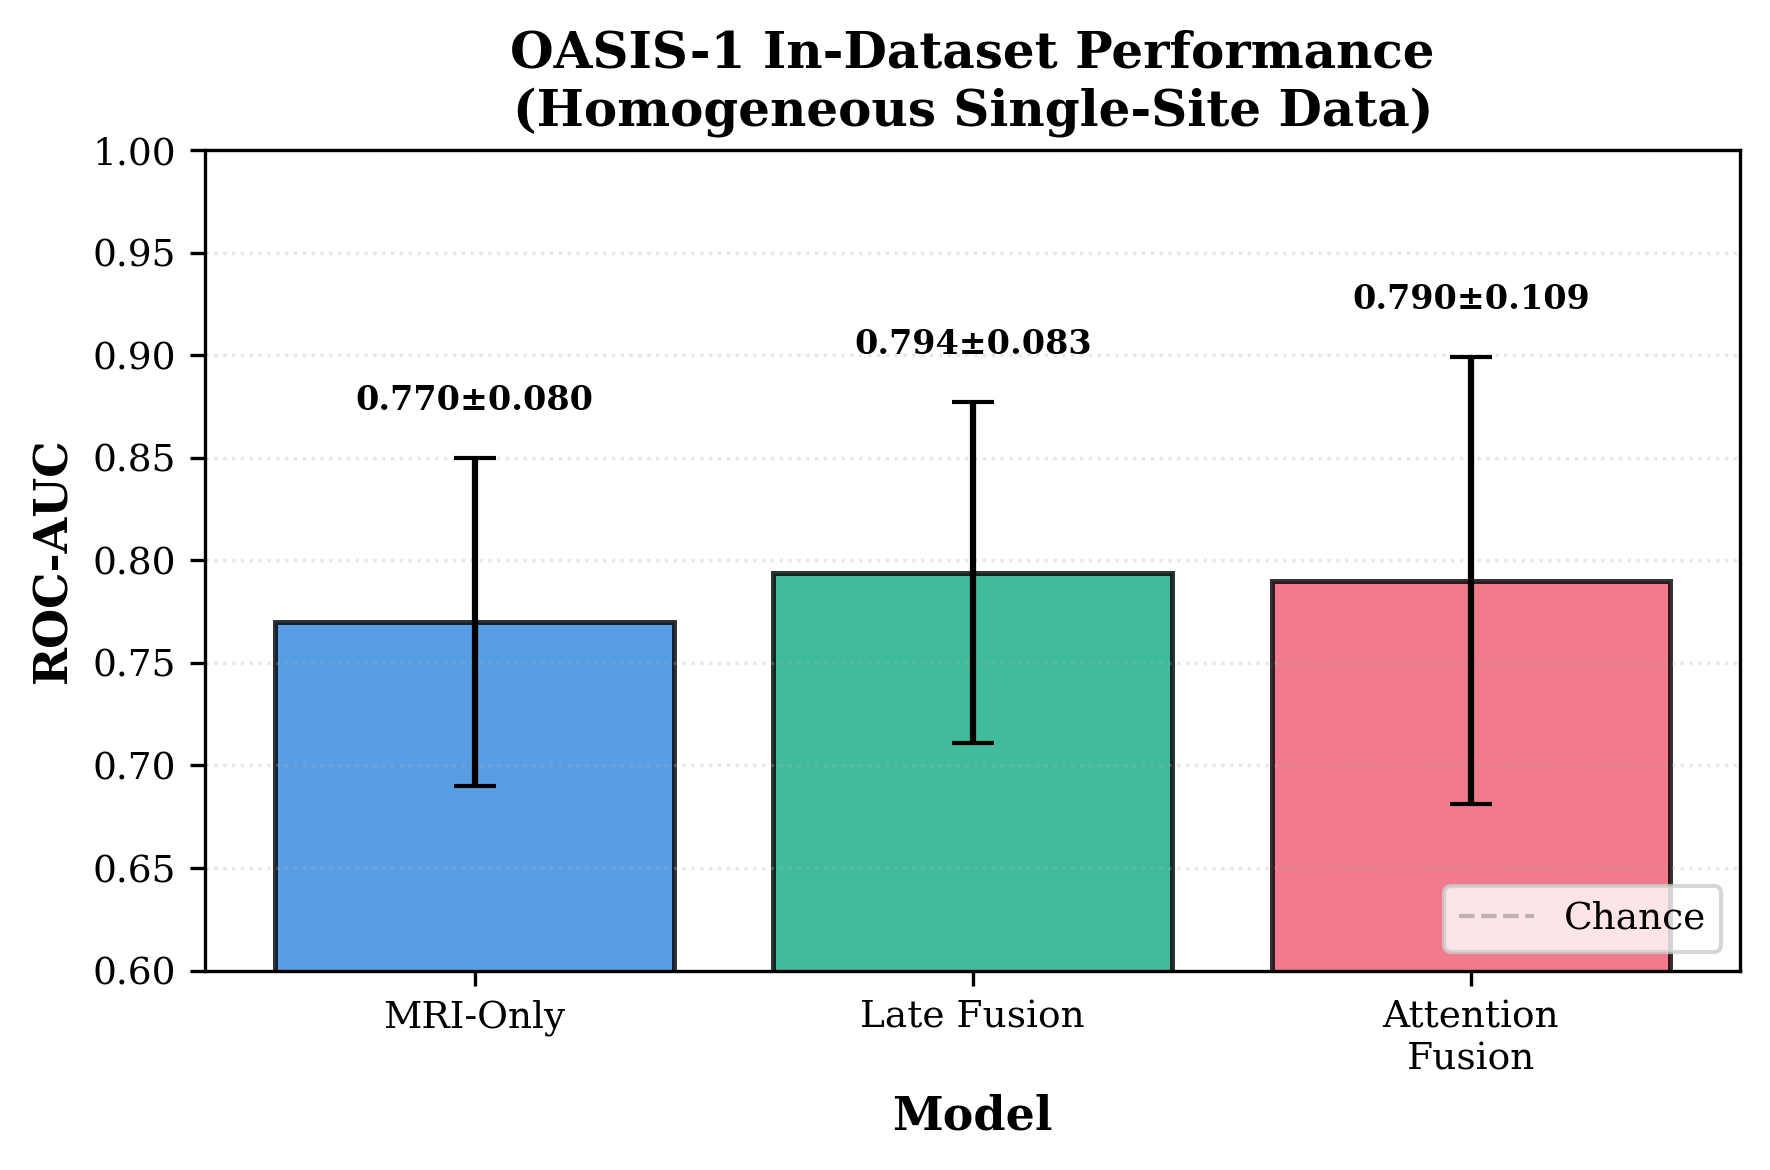
OASIS Model Comparison
Comparison of different model architectures on OASIS-1 dataset showing MRI-only, Late Fusion, and Attention Fusion performance.
MRI-only achieves 0.78 AUC, with minimal gains from fusion approaches.
Click to zoom
A2
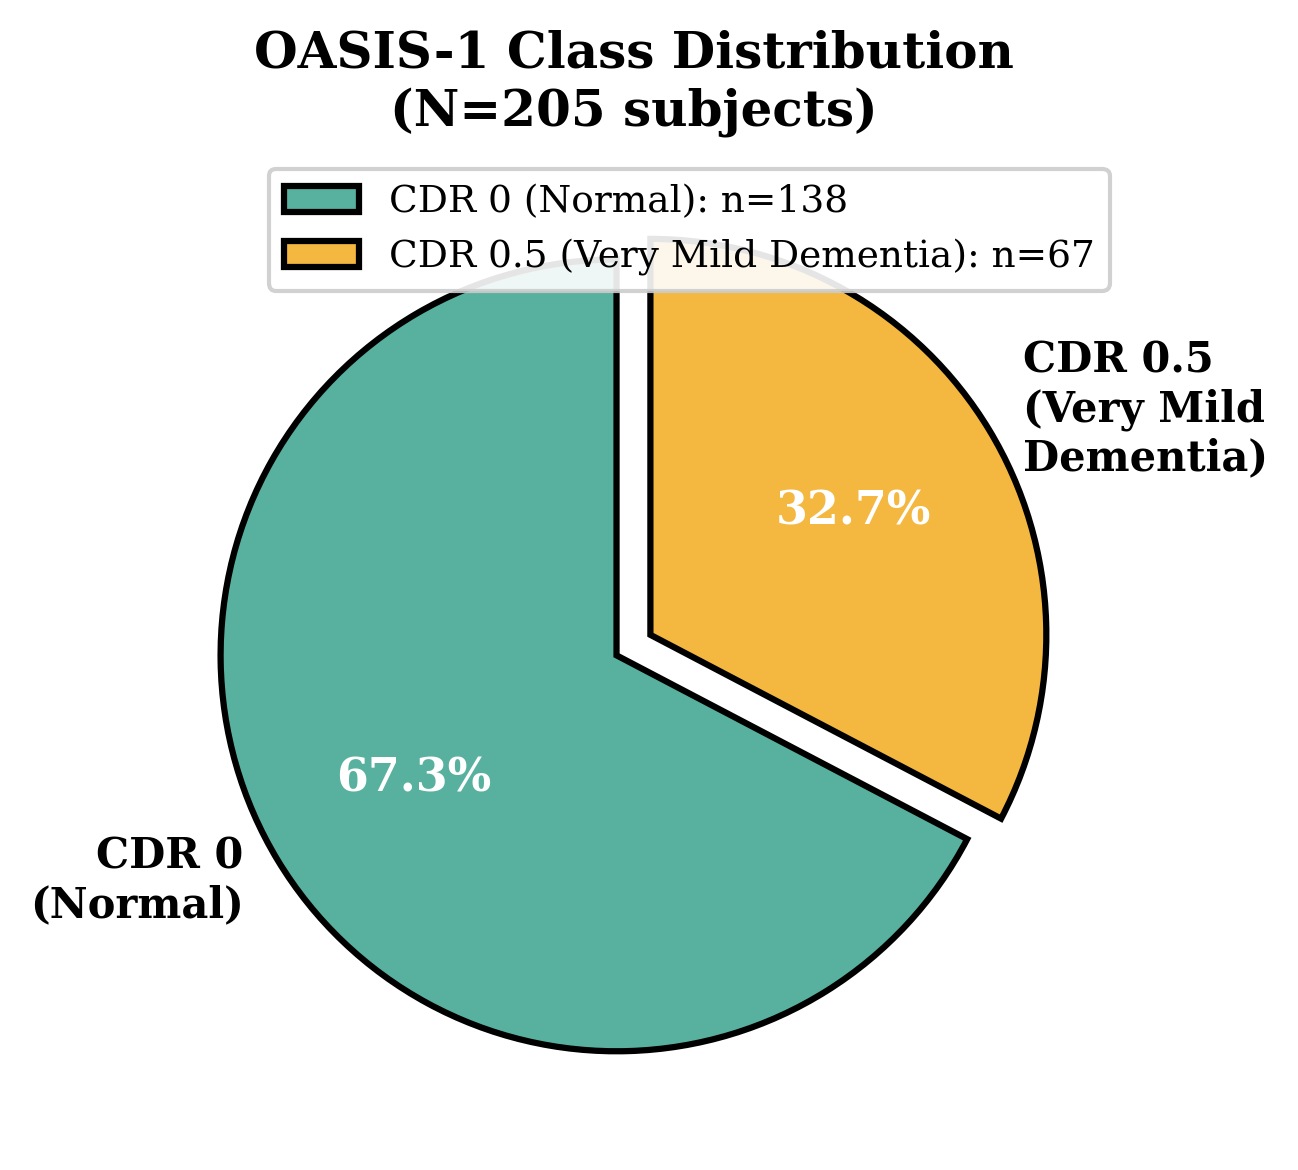
OASIS Class Distribution
Distribution of CDR 0 (healthy) vs CDR 0.5+ (very mild dementia) in OASIS-1 dataset.
Well-balanced dataset with 206 CDR=0 and 230 CDR≥0.5 subjects.
Total Figures
22
Publication-ready
Datasets
2
OASIS-1 + ADNI-1
Key Finding
0.848 AUC
Longitudinal biomarkers
Circularity Gap
+39%
Level-1 vs Level-2
All visualizations are generated from actual research data on OASIS-1 (436 subjects) and ADNI-1 (629 subjects). Click any figure to view full-size with zoom controls.